Beyond Randomness: Unravelling the Mathematics Behind Chaos


We tend to think of the word chaos as general disorder and confusion. Randomness, anarchy, a lack of structure. If you are a fan of Greek mythology (or play the video game Hades), you might know Chaos as a Greek primordial deity. You might have even heard this word used in connection to the famous butterfly effect, the idea that the flapping of a butterfly’s wings can somehow influence the formation of weather systems. And you have more than likely used the word chaotic at some point in your own life to describe the traffic or shopping during Christmas season. Chaos seems to encompass all these concepts and more. But for me, a mathematician, chaos is a very specific thing: a deterministic system that is highly sensitive to initial conditions. That does not sound too bad, but trust me, I would prefer randomness and the ire of Greek deities to this.
Let me explain. A deterministic system is a group of equations or rules that do not have any randomness in them. This could be an apple falling from a tree, the sun rising every day, air going in and out of your lungs. A more mathematical version of this is the following simplified population system: imagine you have bacteria, every hour the bacteria reproduce to double in population. We could express the number of bacteria, which we call \(B\), at hour \(h\) by $$B_{h} = 2B_{h-1}$$
If we start with two bacteria, then the number of bacteria after one hour will be \(B_{1} = 2B_{0} = 4\). This means that if you know the number of bacteria at the beginning, i.e. the initial condition of the system, then you can use the rule above to obtain the bacterial population at the second hour, third hour, and any time afterwards. Therefore, the number of bacteria is completely determined.
If we wanted to add randomness to this system, we could replace the rule of doubling the population of bacteria each hour by the following: each hour the bacteria toss a coin (these are very special sentient and coin-abled bacteria), if the result is tails, they do not reproduce, if it is heads, they double in size. An observant reader might see the connection between this unassuming system with the spread of a virus, like COVID-19, or the flow of information on social media.
How does chaos fit into all of this? Well, chaos occurs when a deterministic system depends so strongly on the initial conditions that we are unable to predict the state of the system in a long time. Now, our bacterial population system is very well behaved and depends nicely on its initial condition, so we will make it slightly more realistic, and, thus, less well behaved.
Our original bacterial population doubled in size each hour, for eternity, but this is impossible in real life. A real population has limits in space and environment. This implies that the bacteria can grow at most to a certain population, called carrying capacity. Then, it becomes much more relevant to study the ratio between the current number of bacteria and the carrying capacity, instead of the number of bacteria \(B\). This ratio, which we call \(X\), will tell us how much of the environment’s full capacity the bacteria is using, e.g. if \(X=0.5\) then the population has reached half its carrying capacity. We can express the change in \(X\) every hour using the following rule:
$$X_{h} = rX_{h-1}(1-X_{h-1})$$
where \(r\) is the growth rate of the bacteria, which was 2 previously. This formula is usually referred as the logistic equation, and I will take you through the most important features of this model.
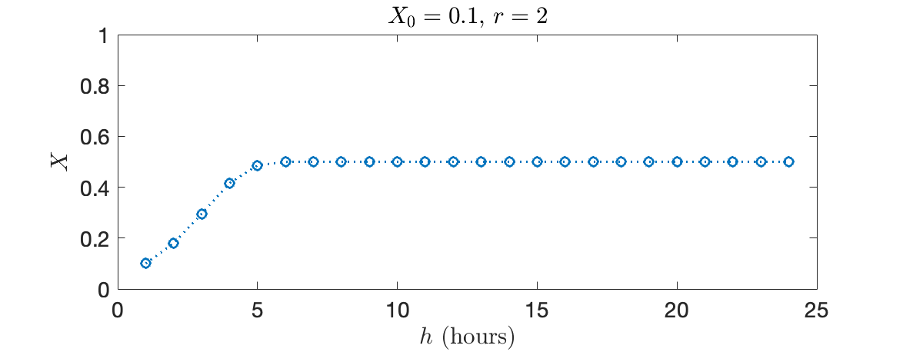
If the growth rate is \(r=2\) and the population is at 10% of the carrying capacity at the beginning, then \(X_{0}=0.1\) and \(X_{1} = 0.2(1-0.1) = 0.18\). After one hour the bacteria achieve 18% of their carrying capacity, in contrast to the 20% it would if they doubled each hour without restrictions. We can map this out to get Figure 1. You can see in the figure that the bacteria will end up at approximately half of their carrying capacity, and that this will remain that way for several hours (if conditions remain the same).
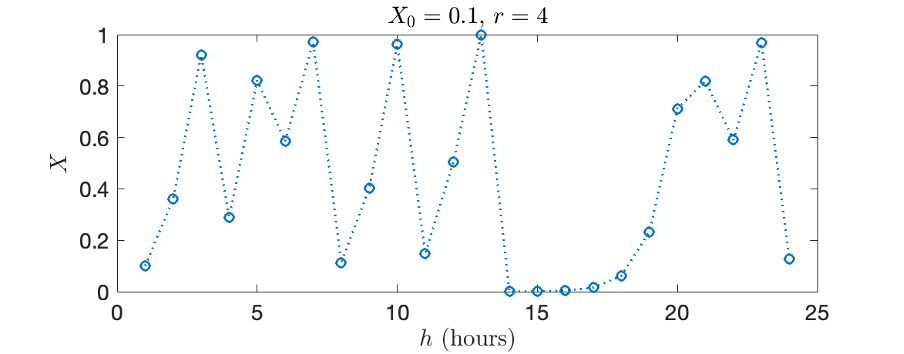
On the other hand, if the growth rate is considerably larger, say \(r=4\), then the ratio oscillates heavily, as seen in Figure 2. In hour 13, the population has grown almost to its maximum, but the next hour most of them die, leaving the remaining bacteria in a very precarious position.
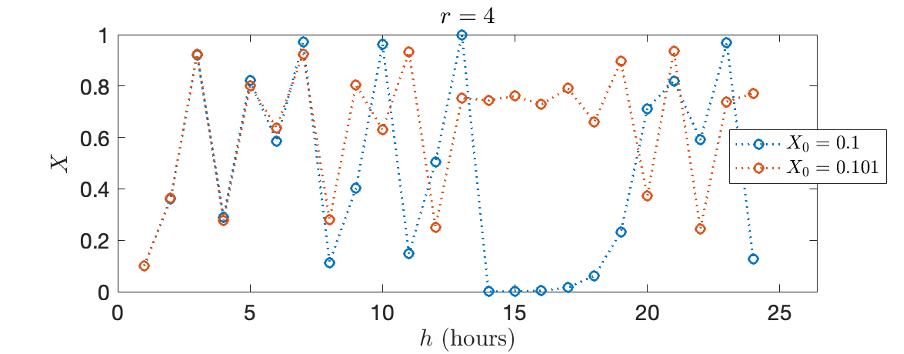
If now the population is at 10.1% of the carrying capacity at the beginning, still with growth rate \(r=4\), then we obtain Figure 3. There, we see that the 10% and 10.1% solutions start very close together but after a few hours they become wildly different, even though we changed the initial condition by just 1% (1% of 10% is 0.1%). Still, do not forget, this is a deterministic system, there is nothing random involved, no coin tosses or dice throwing. And much to the dismay of many mathematicians, this system is chaotic. In other words, if the initial conditions are slightly off, then we are completely unable to predict the state of the population of bacteria a day in the future.
This might sound familiar, as we see this every day in our morning weather news. We, as a species, can predict the weather, which is one of the most important natural phenomena we encounter on a day-to-day basis. It has power over our attire, travel plans, food, health and so many other aspects of our lives. But there is a caveat. We can predict the weather very well for a few hours, satisfactorily for a few days, but for a week or more, almost anything is possible (and equally probable), to the point that the flapping of a butterfly’s wings can influence the formation of a tornado weeks later. Ultimately, the system is truly and utterly chaotic. It makes you rethink the blame we put on weather forecasters when they get it wrong. At the end of the day, they are doing the best they can with the system they have.
Looking for more intellectually powered content? Discover more about chaos, deterministic systems and real-life applications in the module Engaging Complexity at bachelor’s and master’s level at the London Interdisciplinary School. Apply now for 2024 entry to the London Interdisciplinary School!
Share this story


.png)


Don't miss out on important updates including course information, new announcements, Open Day dates and the latest LIS news.


.svg)

This is a comment related to the post above. It was submitted in a form, formatted by Make, and then approved by an admin. After getting approved, it was sent to Webflow and stored in a rich text field.